What is Product Research?
What is product research? It’s the secret sauce behind successful products, the compass guiding companies to create things people actually want. Think of it as detective work, but instead of solving crimes, you’re uncovering customer needs and desires. It’s about understanding your target audience, their pain points, and how your product can offer a solution. This isn’t just guesswork; it’s a structured process involving surveys, interviews, and analyzing data to make informed decisions.
We’ll explore everything from defining product research to analyzing findings and applying those insights to create truly amazing products.
From understanding the various research methodologies—qualitative and quantitative—to mastering the art of interpreting data and translating it into actionable strategies, this journey into product research will equip you with the knowledge to build products people love. We’ll also cover common pitfalls to avoid and essential tools to leverage, ensuring you’re armed with the best practices for success.
Defining Product Research
Product research is the systematic investigation of a product’s market, target audience, and competitive landscape to inform its development and success. It’s essentially detective work for your product idea, helping you understand if it’s truly needed and how best to bring it to market. Think of it as building a strong foundation before you start constructing a house.Product research provides valuable insights that reduce risk and increase the likelihood of a product’s success.
Product research is all about understanding your target audience and their needs. To truly grasp this, you need to know where they hang out online – and for many, that’s YouTube. Check out this awesome guide on getting it on with YouTube to see how you can tap into that market. Understanding YouTube trends is key to effective product research, allowing you to identify unmet needs and refine your product strategy.
A concise definition for beginners would be: Product research is the process of gathering and analyzing information to understand customer needs and preferences, market trends, and competitor offerings, ultimately guiding product development decisions.
Real-World Examples of Successful Product Research
Effective product research can significantly impact a product’s success. Let’s look at three examples:
First, consider the development of the Nintendo Wii. Nintendo conducted extensive research that revealed a growing desire for more accessible and inclusive gaming experiences. This led them to develop the motion-controlled Wii, which appealed to a broader audience than traditional gaming consoles and ultimately dominated the market for several years. This demonstrated the power of understanding unmet customer needs.
Secondly, Netflix’s success is largely attributed to its robust data-driven product research. By analyzing viewing habits and preferences, they’ve not only improved their recommendation algorithms but also informed their original content creation strategy. Their investment in understanding what their users want to watch has made them a global entertainment giant. This showcases the importance of continuous user research.
Finally, the success of the iPhone demonstrates the power of understanding the competitive landscape. Apple’s research identified shortcomings in existing smartphones and capitalized on the opportunity to create a more user-friendly and intuitive device. Their thorough competitive analysis helped them design a product that disrupted the market and set a new standard. This highlights the value of understanding the competitive landscape.
A Simple Flowchart of the Product Research Process
The product research process can be visualized using a flowchart. Imagine a simple flow, starting with defining the problem or opportunity, then moving through several key stages.
The flowchart would begin with a box labeled “Define the Problem/Opportunity.” This would lead to a box labeled “Conduct Secondary Research” (market analysis, competitor analysis, etc.). This then flows into a box labeled “Conduct Primary Research” (user interviews, surveys, usability testing, etc.). The results from primary and secondary research would feed into a box labeled “Analyze Findings and Draw Conclusions.” Finally, the process concludes with a box labeled “Develop Recommendations and Actionable Insights.” This simple visual representation Artikels the core steps involved in a successful product research project.
Types of Product Research
Product research isn’t a one-size-fits-all endeavor. Choosing the right approach depends heavily on your goals, resources, and the stage of your product lifecycle. Understanding the different types of product research and their strengths and weaknesses is crucial for making informed decisions and building successful products. This exploration will cover the major categories, highlighting their unique characteristics and applications.
Broadly speaking, product research can be categorized into qualitative and quantitative methods. These approaches offer complementary insights, providing a more comprehensive understanding of your target market and product potential. While they differ in their methodologies and the type of data they produce, both are invaluable in the product development process.
Qualitative Research Methods
Qualitative research focuses on understanding the ‘why’ behind consumer behavior. It delves into the motivations, attitudes, and perceptions of your target audience, providing rich, nuanced insights that quantitative research often misses. This type of research is particularly useful during the early stages of product development, when you’re trying to understand user needs and preferences.
| Method | Description | Data Type | Application |
|---|---|---|---|
| User Interviews | One-on-one conversations with potential users to explore their needs, experiences, and opinions about your product or a similar product. | Verbal responses, observations | Understanding user needs, identifying pain points, gathering feedback on prototypes. |
| Focus Groups | Moderated discussions with small groups of users to explore their opinions and reactions to a product or concept. | Group discussion, observations | Identifying common themes and opinions, testing marketing messages. |
| Usability Testing | Observing users as they interact with a prototype or existing product to identify usability issues and areas for improvement. | Observations, user actions, verbal feedback | Improving user experience, identifying design flaws. |
| Ethnographic Research | Observing users in their natural environment to understand their behavior and needs in context. | Observations, field notes | Understanding user behavior in real-world settings, identifying unmet needs. |
Quantitative Research Methods, What is product research
Quantitative research emphasizes numerical data and statistical analysis. It aims to measure and quantify aspects of consumer behavior, providing insights into market size, customer preferences, and the effectiveness of marketing campaigns. This approach is often used to validate hypotheses generated through qualitative research or to measure the impact of product changes.
| Method | Description | Data Type | Application |
|---|---|---|---|
| Surveys | Collecting data from a large sample of respondents using questionnaires. | Numerical data, categorical data | Measuring customer satisfaction, understanding market preferences, validating hypotheses. |
| A/B Testing | Comparing two versions of a product or feature to determine which performs better. | Conversion rates, click-through rates | Optimizing website design, improving user engagement. |
| Market Analysis | Analyzing market trends, competitor activity, and customer demographics to identify opportunities and threats. | Market size, growth rates, competitor analysis | Understanding the competitive landscape, identifying target markets. |
Qualitative vs. Quantitative Research: A Comparison
Qualitative and quantitative research methods offer distinct advantages and are often used in conjunction to gain a comprehensive understanding of a product’s market. Qualitative research provides rich, in-depth insights into user motivations and experiences, while quantitative research offers statistically significant data on market trends and customer behavior. For example, qualitative research might reveal that users find a particular feature confusing, while quantitative research could quantify the percentage of users who experience this confusion.
This combined approach allows for a more nuanced and effective product development process.
Conducting Effective Product Research
Product research isn’t just about gathering data; it’s about strategically planning and executing a project to gain actionable insights that inform product development. A well-conducted research project saves time, resources, and ultimately, prevents the launch of a product that doesn’t meet market needs. This section Artikels the key steps to ensure your research is effective and yields valuable results.Planning and Executing a Product Research Project involves a structured approach.
It’s not a haphazard process, but a carefully considered sequence of actions designed to maximize the value of your findings.
Research Project Planning
Before diving into data collection, a thorough plan is essential. This involves defining your research objectives, identifying your target audience, choosing appropriate research methods, and establishing a realistic timeline and budget. Failing to plan properly can lead to wasted resources and inconclusive results. A detailed plan ensures you’re focused on collecting the right data, using the right methods, and analyzing it in a way that answers your key questions.
Essential Considerations Before Starting Research
A comprehensive checklist ensures you’re prepared for every eventuality. Overlooking even a minor detail can derail the entire process.
- Clearly defined research objectives: What specific questions are you trying to answer?
- Target audience identification: Who are you researching? Be specific about demographics, psychographics, and behaviors.
- Methodology selection: Which research methods (surveys, interviews, focus groups, usability testing) are most appropriate for your objectives and target audience?
- Resource allocation: How much time, money, and personnel will the project require?
- Ethical considerations: Have you considered data privacy and informed consent?
- Data analysis plan: How will you analyze the collected data to draw meaningful conclusions?
- Reporting strategy: How will you communicate your findings to stakeholders?
Defining Clear Research Objectives
The foundation of any successful research project lies in clearly defined objectives. Vague objectives lead to ambiguous results and wasted effort. Specific, measurable, achievable, relevant, and time-bound (SMART) objectives ensure your research stays focused and yields actionable insights. For example, instead of aiming to “understand customer preferences,” a SMART objective would be “to determine the top three features desired by 80% of our target customers within the next two months.”
Developing a Well-Structured Research Questionnaire
A well-structured questionnaire is crucial for gathering accurate and reliable data. Poorly designed questionnaires can lead to biased responses and invalid conclusions.
- Start with easy, non-threatening questions to build rapport.
- Use clear and concise language, avoiding jargon or technical terms.
- Employ a variety of question types (multiple choice, rating scales, open-ended) to gather comprehensive data.
- Avoid leading questions that might bias responses.
- Keep the questionnaire concise and focused to avoid respondent fatigue.
- Pilot test the questionnaire with a small group before widespread distribution to identify and correct any flaws.
Analyzing Research Findings: What Is Product Research
Source: theaiminstitute.com
So, you’ve gathered all your data – surveys, interviews, usability tests, the works. Now what? The real magic happens when you start analyzing your product research findings. This isn’t just about crunching numbers; it’s about uncovering insights that will shape your product’s future. This stage is crucial for transforming raw data into actionable strategies.Interpreting data requires a systematic approach.
It’s about understanding the patterns, trends, and anomalies within your dataset. Don’t just look at the numbers in isolation; consider the context of your research questions and your target audience. For example, a low satisfaction score on a specific feature might indicate a need for redesign, but only after considering the overall user feedback and the importance of that feature to the overall user experience.
Qualitative data, such as interview transcripts, needs careful thematic analysis to identify recurring themes and sentiments. Quantitative data, like survey responses, requires statistical analysis to identify significant differences and correlations.
Data Visualization Techniques
Effective data visualization is essential for communicating research findings clearly and concisely. Visuals make complex data easier to understand and help identify patterns that might be missed in raw data tables. Several methods can effectively present research results.
- Bar charts: Ideal for comparing different categories, such as feature preferences or user demographics.
- Pie charts: Useful for showing proportions or percentages, like the breakdown of user satisfaction levels.
- Line graphs: Excellent for illustrating trends over time, such as website traffic or app downloads.
- Scatter plots: Show the relationship between two variables, helping to identify correlations (for example, correlation between user engagement and feature usage).
- Heatmaps: Useful for visualizing data density across a two-dimensional space, such as user clicks on a website.
For instance, a bar chart could clearly show the preference for different color options in a new product, while a line graph could demonstrate the growth of user engagement after implementing a specific feature update. Choosing the right visualization depends on the type of data and the message you want to convey.
Drawing Meaningful Conclusions
Drawing meaningful conclusions requires critical thinking and a deep understanding of your data. Avoid jumping to conclusions based on isolated findings; consider the bigger picture. Look for patterns and trends, and consider potential biases in your data collection methods.For example, a high positive response rate in a customer survey might be skewed if the survey was only sent to existing, satisfied customers.
Always consider the limitations of your research and acknowledge any potential biases in your analysis. It’s also crucial to differentiate between correlation and causation. Just because two variables are correlated doesn’t necessarily mean one causes the other.
A Typical Data Analysis Process
Imagine a flowchart. The process begins with “Data Collection,” a large box at the top. An arrow points down to a box labeled “Data Cleaning,” where inconsistencies and errors are removed. From there, another arrow points to “Data Transformation,” where data is organized and prepared for analysis (e.g., converting categorical data into numerical representations). This leads to “Exploratory Data Analysis,” where initial patterns are identified using descriptive statistics and visualizations.
This is followed by “Statistical Analysis” (if applicable), using inferential statistics to test hypotheses and draw conclusions. The final arrow points to “Interpretation and Reporting,” the last box, representing the presentation of findings and recommendations. Each box is connected by arrows showing the sequential nature of the process, highlighting the iterative nature of data analysis – often requiring revisiting earlier stages based on findings.
Applying Research Insights

Source: conceptboard.com
Product research isn’t just about gathering data; it’s about using that data to build better products and make smarter business decisions. The insights gleaned from thorough research directly influence every stage of product development, from initial concept to post-launch analysis. Effectively applying these insights is crucial for success.The process of translating research findings into actionable improvements involves careful analysis and interpretation.
We need to move beyond simply identifying user needs and pain points; we must understandwhy* those needs exist and how they can be addressed within the constraints of our product vision and resources. This involves prioritizing findings based on their impact and feasibility. For example, if research reveals a significant usability issue impacting a large segment of users, that issue should be prioritized over a less impactful, niche problem.
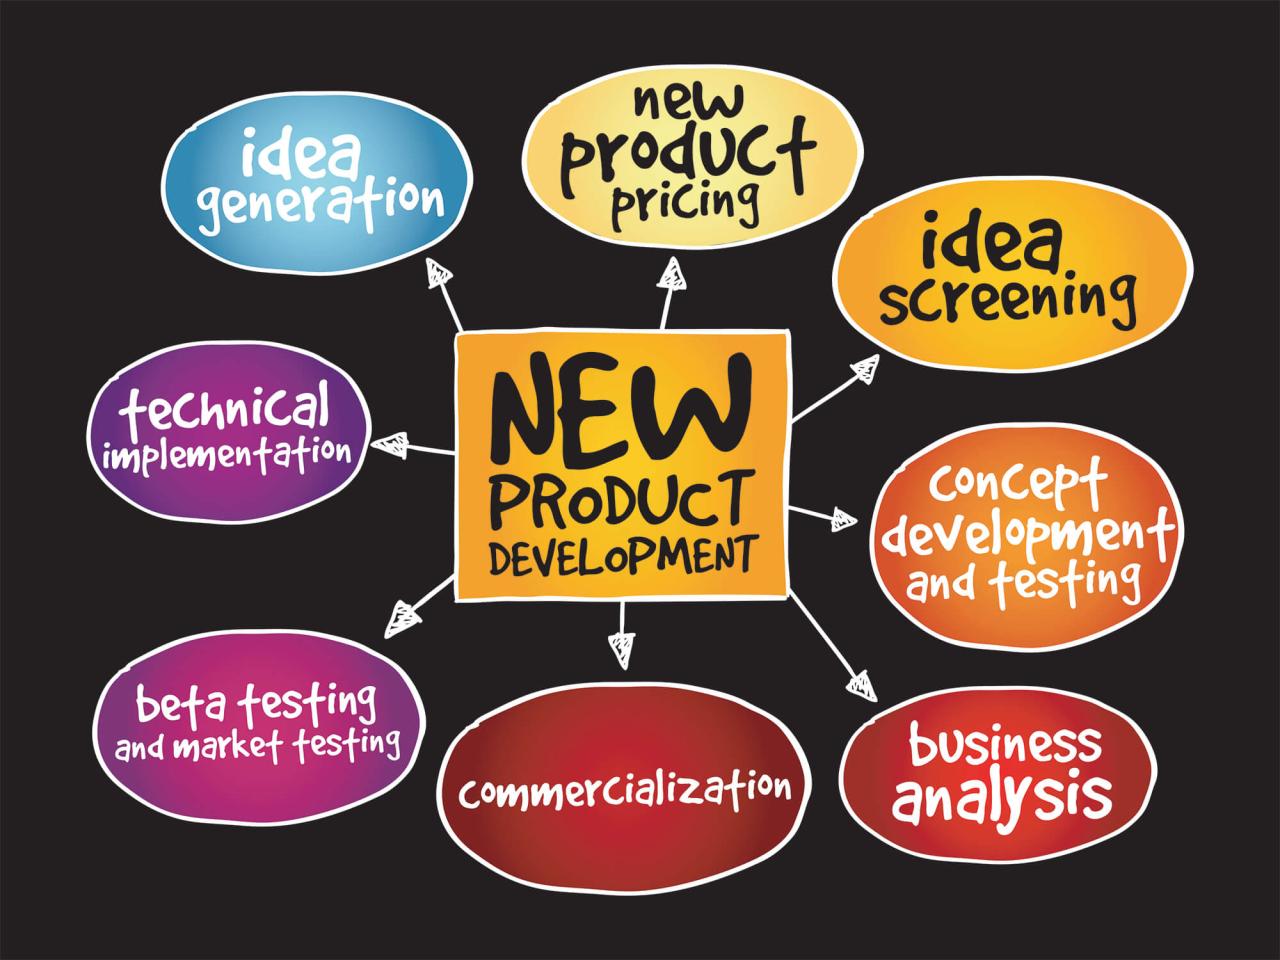
Product Development Informed by Research
Research findings directly shape the product development roadmap. For instance, user testing might reveal that a particular feature is confusing or difficult to use. This information allows the development team to redesign the feature for improved usability, potentially through simplified navigation, clearer instructions, or a more intuitive interface. Similarly, market research can highlight unmet needs or underserved segments, guiding the development of entirely new features or even new product lines.
The entire design and development process becomes more efficient and targeted when informed by a deep understanding of the target audience. Consider a hypothetical scenario where user research reveals a strong preference for a specific color scheme. This insight directly informs the design team’s choices, leading to a product that is more aesthetically pleasing and resonates better with the target audience.
Translating Research into Actionable Improvements
Turning research data into tangible product changes requires a structured approach. This typically involves prioritizing findings based on their impact and feasibility. A common technique is to use a prioritization matrix, plotting findings based on their impact on user satisfaction and the effort required to implement a solution. High-impact, low-effort changes are tackled first, followed by more challenging but still important improvements.
For example, a simple change to button placement might significantly improve conversion rates, while a complete redesign of a core feature might require more extensive development time and resources. This strategic approach ensures that resources are allocated effectively and that the most impactful changes are made first.
Iterative Product Development Based on Research
Successful product development is rarely a linear process. Instead, it’s iterative, with research informing each stage of development. After an initial launch, further research is conducted to understand how users are interacting with the product, identifying areas for improvement. This feedback is then used to iterate on the product, creating a continuous cycle of refinement. For example, A/B testing different versions of a landing page can reveal which design elements are most effective in driving conversions.
This data then informs future design decisions, leading to a continually optimized product experience. This iterative approach, guided by ongoing research, is essential for long-term product success.
Five Ways Product Research Impacts Business Decisions
Research plays a vital role in shaping crucial business decisions. Here are five key examples:
- Product Strategy: Research helps define the target market, identify unmet needs, and validate product concepts, leading to more effective product strategies.
- Resource Allocation: By understanding user priorities, companies can allocate resources more efficiently, focusing development efforts on features with the highest potential impact.
- Pricing Strategies: Market research informs pricing decisions, ensuring that products are priced competitively while still generating sufficient profit margins.
- Marketing Campaigns: Understanding user preferences and behavior through research allows for more targeted and effective marketing campaigns.
- Go-to-Market Strategy: Research helps determine the optimal launch strategy, identifying the most effective channels and messaging to reach the target audience.
Common Mistakes in Product Research
Source: slideteam.net
Product research is crucial for success, but even experienced teams fall into traps. Overlooking key steps or misinterpreting data can lead to wasted resources and flawed product launches. Understanding common pitfalls and developing strategies to avoid them is essential for conducting effective research and building successful products. This section will highlight some prevalent mistakes and offer solutions to improve your research process.
Ignoring Target Audience Feedback
Failing to properly understand your target audience’s needs, wants, and pain points is a critical mistake. This often stems from relying on assumptions instead of direct feedback. For example, a company might assume their customers want a feature based on internal discussions, neglecting to validate this assumption through user interviews or surveys. The consequence? Developing a product nobody wants or needs, resulting in low adoption rates and financial losses.
To mitigate this, employ a variety of research methods, including user interviews, surveys, focus groups, and usability testing, to gather diverse perspectives and ensure you’re building a product that resonates with your target audience.
Focusing Solely on Quantitative Data
While numbers are important, relying solely on quantitative data, such as website analytics or sales figures, provides an incomplete picture. Quantitative data can tell you
- what* is happening, but not necessarily
- why*. For instance, high bounce rates on a landing page indicate a problem, but only qualitative research, like user interviews, can uncover the underlying reasons—poor design, confusing messaging, or slow loading times. Ignoring qualitative data leads to superficial solutions that may not address the root cause of the issue. A balanced approach, combining both quantitative and qualitative data, offers a richer understanding of user behavior and product performance.
Insufficient Sample Size
Using a sample size that’s too small to represent the target audience accurately leads to skewed results and unreliable conclusions. Imagine a company conducting a survey with only 20 respondents to determine customer preference for a new product feature. The findings would be highly susceptible to sampling bias and unlikely to reflect the preferences of the broader customer base.
This can lead to misinformed product decisions. To avoid this, ensure your sample size is sufficiently large and representative of your target audience, using appropriate statistical methods to determine the required sample size based on your desired level of confidence and margin of error.
Bias in Research Design and Questioning
Leading questions, poorly designed surveys, or biased sampling techniques can introduce significant bias into the research process. For example, a question like, “Don’t you agree that our new feature is amazing?” is leading and will likely elicit biased responses. Similarly, a survey that only targets a specific demographic might not represent the views of the entire target audience. The result is skewed data that doesn’t accurately reflect reality.
Careful consideration of research design, including unbiased question phrasing and representative sampling, is crucial to ensure the validity and reliability of the findings. Employing a blind or double-blind approach, where researchers are unaware of the hypotheses being tested, can further minimize bias.
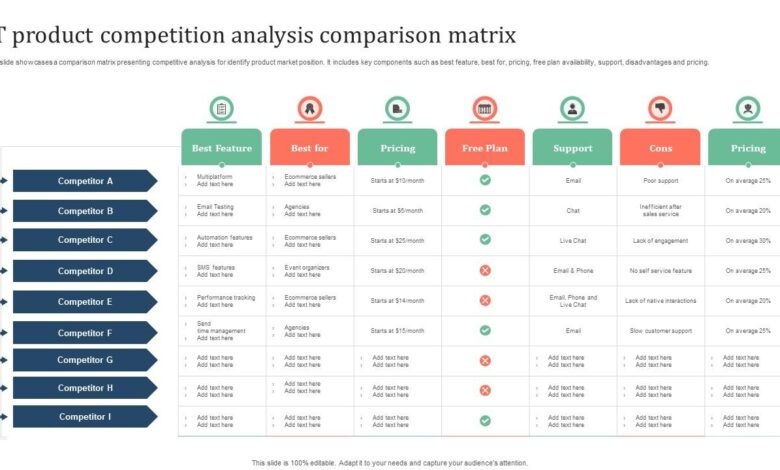
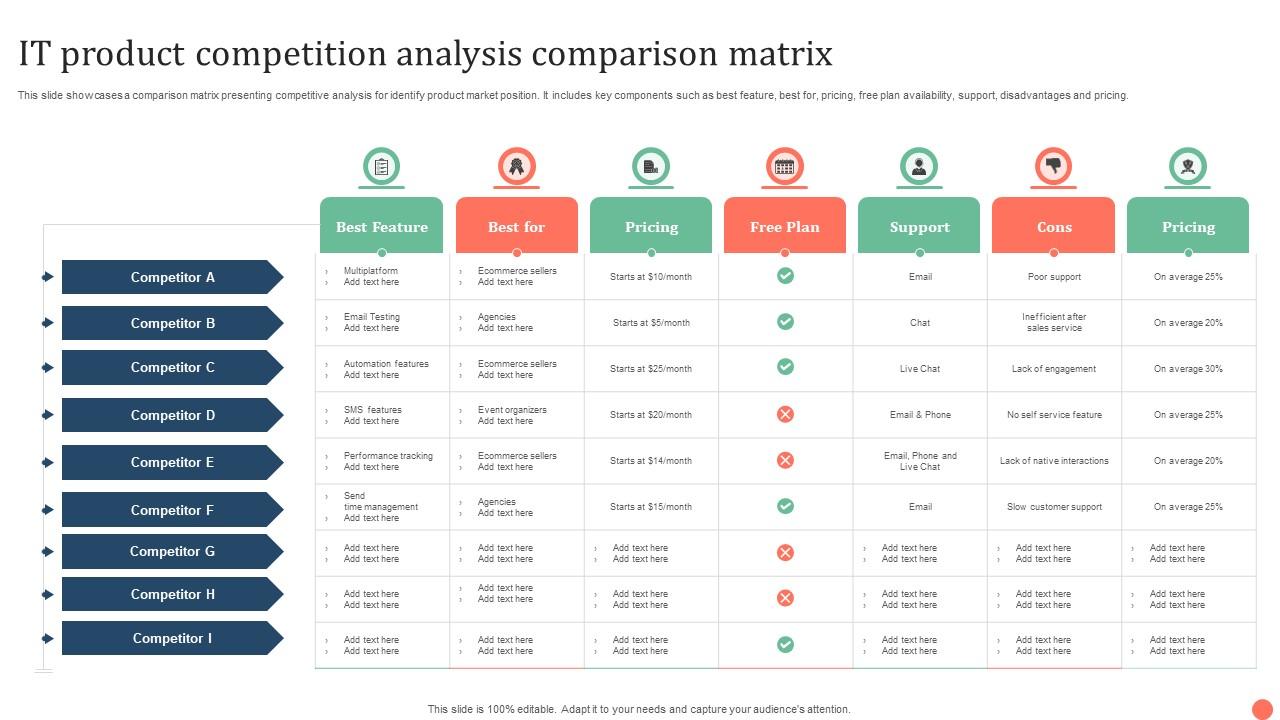
Neglecting Competitive Analysis
Understanding the competitive landscape is critical for differentiating your product and identifying opportunities. Ignoring competitive analysis can lead to missed opportunities and a lack of innovation. A company might launch a product with features already offered by competitors, resulting in a lack of market differentiation and decreased competitiveness. To avoid this, conduct thorough competitive analysis, examining competitors’ strengths and weaknesses, their target audiences, and their marketing strategies.
This analysis should inform your product development strategy and help you identify opportunities to differentiate your product in the market.
Tools and Resources for Product Research
Effective product research relies heavily on the right tools and resources. Choosing the appropriate tools depends on your research goals, budget, and the complexity of your product. From simple surveys to sophisticated analytics platforms, a range of options exist to help you gather and interpret data effectively. Understanding these options is crucial for making informed product decisions.
The tools and resources available for product research span a wide spectrum, encompassing both free and paid options, simple and complex platforms. Careful consideration of your specific needs and resources is paramount in selecting the most suitable tools for your project. This will ensure you gather high-quality data and ultimately make better product decisions.
Survey Platforms
Online survey platforms are a cornerstone of product research, allowing you to collect quantitative and qualitative data from a large number of respondents. These platforms offer features such as branching logic, pre-built templates, and data analysis tools, simplifying the survey creation and analysis process. They vary significantly in their pricing models, features, and target audiences.
- SurveyMonkey: A popular platform offering a range of features, from basic surveys to advanced analytics. It caters to both individuals and businesses.
- Typeform: Known for its visually appealing and user-friendly interface, Typeform excels at creating engaging surveys that encourage higher completion rates.
- Google Forms: A free and readily accessible option, integrated with other Google services, making it ideal for quick and simple surveys.
User Feedback Tools
Gathering direct feedback from users is essential for understanding their needs and preferences. Dedicated user feedback tools offer features like in-app feedback forms, polls, and sentiment analysis, providing valuable insights into user experience.
- Hotjar: This platform provides heatmaps, session recordings, and feedback polls, offering a comprehensive view of user behavior on your website or app.
- UserTesting: UserTesting allows you to recruit and pay participants to complete specific tasks on your website or app, providing detailed feedback through video recordings and written comments.
- UsabilityHub: This platform specializes in usability testing, offering various test types like first-click testing, five-second tests, and preference tests.
Data Analysis Software
Once you’ve collected your data, you’ll need software to analyze it effectively. These tools range from spreadsheet programs to specialized statistical software packages, each with its own strengths and weaknesses.
- Microsoft Excel/Google Sheets: Suitable for basic data analysis, including calculating averages, percentages, and creating simple charts.
- SPSS: A powerful statistical software package used for advanced data analysis, particularly suited for large datasets and complex statistical modeling.
- R: A free and open-source statistical programming language used by many researchers and data scientists for advanced analysis.
Qualitative Data Analysis Software
For qualitative research, such as interviews or focus groups, specialized software can help you organize, code, and analyze textual data. These tools aid in identifying patterns, themes, and insights within large amounts of qualitative information.
- NVivo: A popular qualitative data analysis software used for managing, analyzing, and visualizing qualitative data from various sources, such as interviews, focus groups, and observations.
- ATLAS.ti: Another widely used qualitative data analysis software that helps researchers organize, analyze, and interpret textual, visual, and audio data.
- MAXQDA: This software provides tools for qualitative data analysis, including coding, memoing, and visualization, allowing for efficient analysis of textual and multimedia data.
Comparison of Research Tools
Here’s a comparison of three popular research tools, highlighting their key features, costs, and pros and cons:
| Name | Features | Cost | Pros/Cons |
|---|---|---|---|
| SurveyMonkey | Survey creation, distribution, analysis, various question types, branching logic, data export | Subscription-based, ranging from free to enterprise-level plans | Pros: User-friendly, wide range of features, good reporting. Cons: Can be expensive for advanced features, limited customization options for free plan. |
| Hotjar | Heatmaps, session recordings, feedback polls, form analysis, surveys | Subscription-based, varying plans based on features and usage | Pros: Visual insights into user behavior, valuable for usability testing. Cons: Can be expensive, requires some technical knowledge to fully utilize. |
| Google Forms | Simple survey creation, basic analysis, free, integrates with other Google services | Free | Pros: Free, easy to use, quick setup. Cons: Limited features compared to paid platforms, less advanced analysis capabilities. |
Concluding Remarks
So, what have we learned? Product research isn’t just a nice-to-have; it’s the bedrock of any successful product launch. By understanding your customers, utilizing the right research methods, and analyzing your data effectively, you can significantly increase your chances of creating a product that resonates with your target market and drives business growth. Remember, it’s an iterative process – constantly learning, adapting, and improving based on your findings.
Embrace the journey of discovery, and watch your product flourish!
Essential Questionnaire
What’s the difference between market research and product research?
Market research focuses on the broader market landscape, including competitors and overall trends. Product research is more specific, focusing on a particular product or service and its target audience.
How much does product research cost?
The cost varies greatly depending on the scope and methods used. Simple surveys can be inexpensive, while extensive user testing can be quite costly.
How long does product research take?
The timeline depends on the project’s complexity. Smaller projects might take a few weeks, while larger ones can span several months.
What if my research shows my product idea is flawed?
This is valuable information! It’s better to discover flaws early in the process than after significant investment. Use the feedback to refine your idea or pivot to a different approach.