
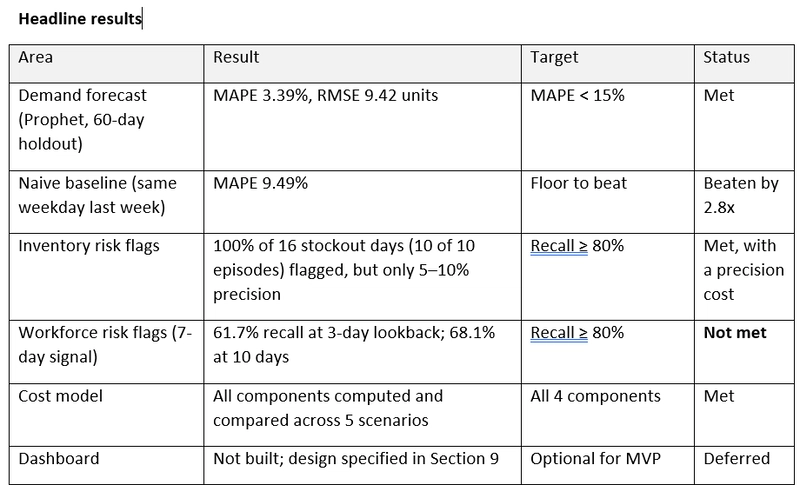

Recent analyses of operational supply chains have underscored the critical need for advanced decision-support architecture, particularly within consumer-goods sectors characterized by high seasonal volatility. A comprehensive technical report documenting a dual-purpose predictive inventory and workforce planning system sheds light on how businesses can synchronize stock management with labor forecasting. Utilizing a robust two-year dataset spanning from January 1, 2023, to December 30, 2024, the report provides a detailed blueprint for mitigating stockout risks, optimizing headcount, and quantifying business impacts in Indian Rupees (INR).

Background Context and System Architecture
Modern retail and consumer hardware markets face immense pressure from fluctuating consumer demand, promotional spikes, and supply chain disruptions. Traditional planning methods often operate in silos, treating inventory replenishment and staffing requirements as entirely separate operational challenges. This disconnect frequently results in excess labor costs, unexpected stockouts, or inflated holding expenditures.
The newly documented decision-support system addresses this challenge through a decoupled architecture. The framework ingests historical sales, inventory, and workforce metrics across 730 daily rows. While the inventory and workforce modules both ingest units sold for traceability, they operate independently of one another. This design ensures that each branch remains modular, testable, and capable of functioning via a shared forecasting interface. Machine learning models predict demand under uncertainty, while deterministic operations-research formulas—such as economic order quantity (EOQ) and reorder point (ROP) calculations—parameterize the downstream supply chain and labor requirements.

Demand Patterns and Market Dynamics
A granular examination of the 730-day dataset reveals distinct behavioral trends and seasonal rhythms governing the market for the EcoFit Smart Bottle. Average daily demand demonstrated notable year-on-year growth, climbing from 216.3 units in 2023 to 237.5 units in 2024, marking a 9.8% expansion.
Yearly seasonality proved to be a major driver of operational variance. Monthly mean demand historically troughs in January at 181 units before surging to a peak of 271 units in June—representing a substantial 50% swing. By December, demand typically normalizes to approximately 198 units. Weekly trends further reinforce consumer habits: Saturdays record the highest average demand at 245.6 units, followed closely by Sundays (239.0 units) and Fridays (231.2 units), while Tuesdays represent the weekly low at 215.0 units.

External levers also significantly shape sales volume. Promotional days generate an average of 253.2 units compared to 224.6 units on non-promotional days, translating to a 12.7% uplift. Furthermore, pricing strategies shifted across four distinct regimes—INR 250, 260, 245, and 270—with adjustments implemented on June 30, 2023, January 1, 2024, and July 4, 2024, respectively.
Chronology of Data Governance and Anomaly Detection
Maintaining data integrity required rigorous anomaly detection using a robust z-score methodology applied to residuals from a 15-day centered rolling median, utilizing a strict threshold of absolute z greater than four. This process identified seven anomalous days characterized by sudden sales crashes or extreme spikes.

Rather than allowing these distortions to compromise predictive accuracy, analysts designated the anomaly days as missing values and applied linear interpolation for the training targets, while retaining raw values for evaluation purposes. Comparative testing revealed that a Prophet forecasting model trained on the cleaned series achieved a Mean Absolute Percentage Error (MAPE) of 3.39%, outperforming the 4.01% error rate recorded on the uncleaned dataset.
Lag-structure evaluations of external regressors provided crucial insights into consumer responsiveness. Correlation analyses confirmed that marketing expenditure operates with a definitive one-day lag, while web search interest exhibits a two-day lag. These findings validate the inclusion of leading indicators in predictive modeling.

Comparative Forecasting Performance
The demand-forecasting module evaluated multiple algorithmic approaches using a time-based split, utilizing training data from January 1, 2023, through October 31, 2024, and holding out the final 60 days of 2024 for testing.
Prophet emerged as the superior model for long-horizon forecasting, capturing trend components along with weekly and yearly seasonality while integrating five key regressors: marketing spend, web search interest, competitor price index, promotion flags, and holiday indicators. Prophet not only outperformed baseline heuristics and XGBoost variants but also produced well-calibrated prediction intervals, with 95% of actual test values falling securely within its 95% confidence bands.

Component breakdown analysis highlighted that yearly seasonality exerts the most substantial influence on demand fluctuations, contributing an average standard deviation of 24.5 units per day. Weekly seasonality contributed 11.3 units, the baseline trend accounted for 9.3 units, and regressors collectively contributed 13.9 units. Among individual regressors, lagged marketing spend proved most impactful, capable of driving up to a 55.6-unit increase on peak expenditure days.
Inventory Optimization and Risk Mitigation
To prevent costly stockouts while controlling holding expenses, the inventory module implements dynamic safety stock and reorder point formulas. Safety stock is calculated using a standard service-level multiplier ($z = 1.65$ for a 95% service level) factored against the 30-day rolling standard deviation of demand and lead time.

With a historical average planning lead time of approximately 4.96 days, the calculated reorder point averaged 1,208 units, aligning closely with historical dataset parameters. Economic Order Quantity (EOQ) modeling, anchored by an ordering cost of INR 500 and an annual holding cost of INR 8 per unit, yielded an optimal order size of 3,305 units based on 2024 annual demand.
Backtesting stockout risks revealed a 100% recall rate across multiple threshold settings, successfully flagging all ten distinct stockout episodes. However, operational analysts noted a low precision rate due to the low base rate of stockouts, indicating that further threshold tuning is necessary to minimize false alarms. Deeper investigation into stockout episodes uncovered that supply chain failures were rarely driven by extreme logistical breakdowns; instead, they stemmed from planning lead times that were marginally too optimistic (assuming 5 days when actual delivery took 6 to 7 days) combined with end-of-day reorder checks.

Workforce Planning and Labor Dynamics
Workforce requirements were modeled by translating the 7-day forward-moving average forecast into required headcount, operating on a benchmark of 25 units processed per worker daily. Backtesting revealed that while smoothed signals effectively capture sustained operational shifts, 51% of daily backlog days remained invisible to 7-day averages due to single-day demand spikes.
To address this structural limitation, the report recommends a dual-signal framework: a 7-day moving signal to guide long-term hiring decisions—factoring in a mandatory 10-day onboarding lag for new staff—and a short-window 1-day to 3-day spike signal to trigger flexible staffing or overtime alerts.

Forward projections for early 2025 indicate a required headcount of 9 workers based on the 30-day demand forecast. Because current staffing stands at 11 workers, operations are positioned to absorb projected demand without immediate recruitment, though management carries a minor labor surplus.
Integrated Cost Model and Business Implications
To evaluate the financial trade-offs of various operational policies, an integrated cost model expressed expenses in Indian Rupees. Scenario analyses isolating policy effects demonstrated that maintaining excessive staffing does not necessarily yield overall savings; increasing baseline staff from 9 to 11 individuals escalated annual wage expenses by INR 657,000 while saving INR 370,251 in overtime and minor backlog costs, resulting in a net cost increase of 7.4%.

Conversely, tightening inventory service levels proved highly cost-effective. Elevating the service-level factor from $z = 1.65$ to $z = 2.33$ incurred a negligible holding cost increase of INR 307 while eliminating INR 6,649 in expected stockout penalties.
Ultimately, the technical report provides executive leadership with a quantitative foundation for future scalability. By automating the convergence of predictive analytics, deterministic inventory mathematics, and workforce scheduling, the EcoFit Smart Bottle operational framework establishes a replicable standard for modern supply chain management.