
In the dynamic landscape of digital marketing, where complex concepts and intricate strategies abound, visual aids have emerged as a critical tool for clarity and comprehension. Recognizing this, Orbit Media has curated an extensive collection of over 59 charts and diagrams, meticulously compiled over 15 years of publishing digital marketing insights. These visuals, categorized into four key areas—Content Marketing, SEO and AI Search Optimization, Social Media and Influencer Marketing, Web Design and UX, and Data-Driven Marketing—serve as powerful accelerators for understanding challenging marketing principles.
This resource not only provides a visual lexicon for marketers but also offers a unique opportunity to leverage these assets. Orbit Media explicitly permits the use of these diagrams in readers’ own marketing efforts, provided proper attribution and a link to the original source are included. For those seeking further context or a tailored quote to accompany an image, the company offers direct assistance through its contact page.
Decoding Content Marketing with Visual Precision
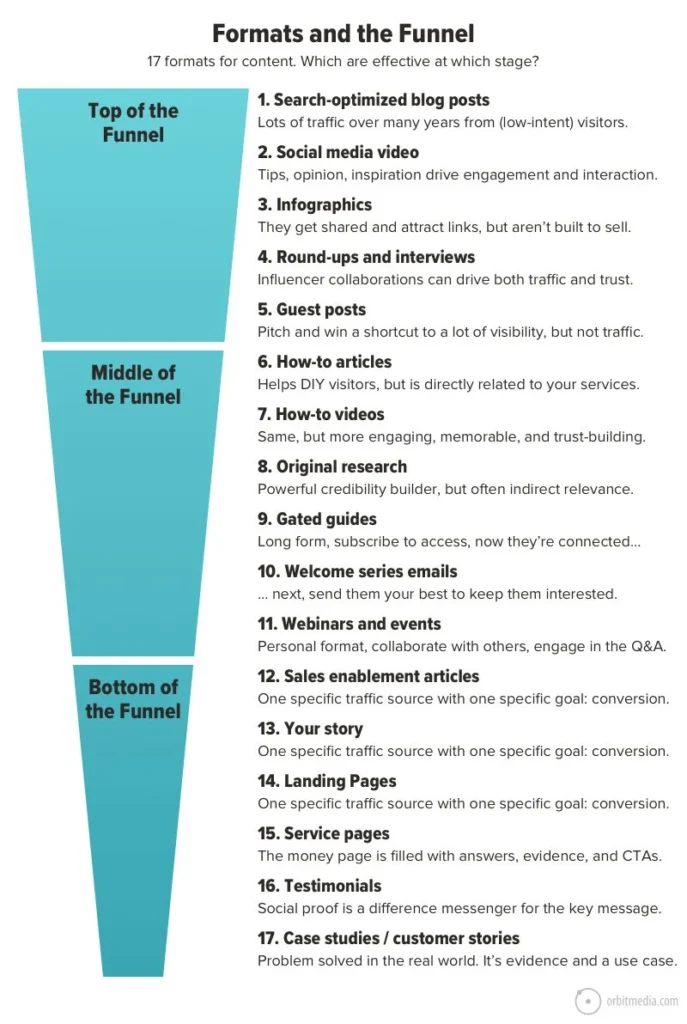
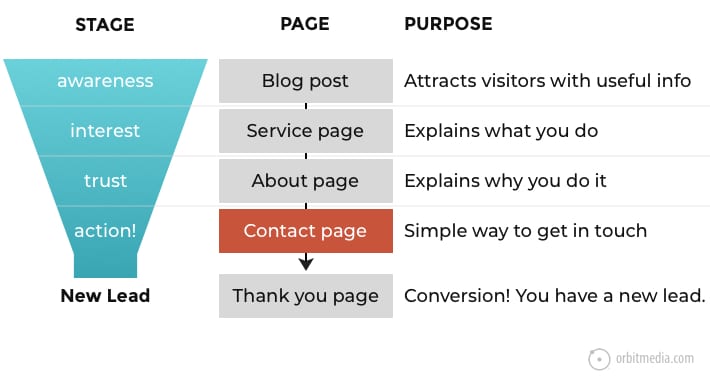
The realm of content marketing, often characterized by its multifaceted strategies, is made accessible through a series of illuminating diagrams. One such visual, "Formats and the Funnel," maps out various content formats against their ability to attract visitors and build trust. This strategic overview empowers marketers to thoughtfully integrate different content types into their mix to achieve specific outcomes, transforming the often-elusive content strategy into a tangible plan.
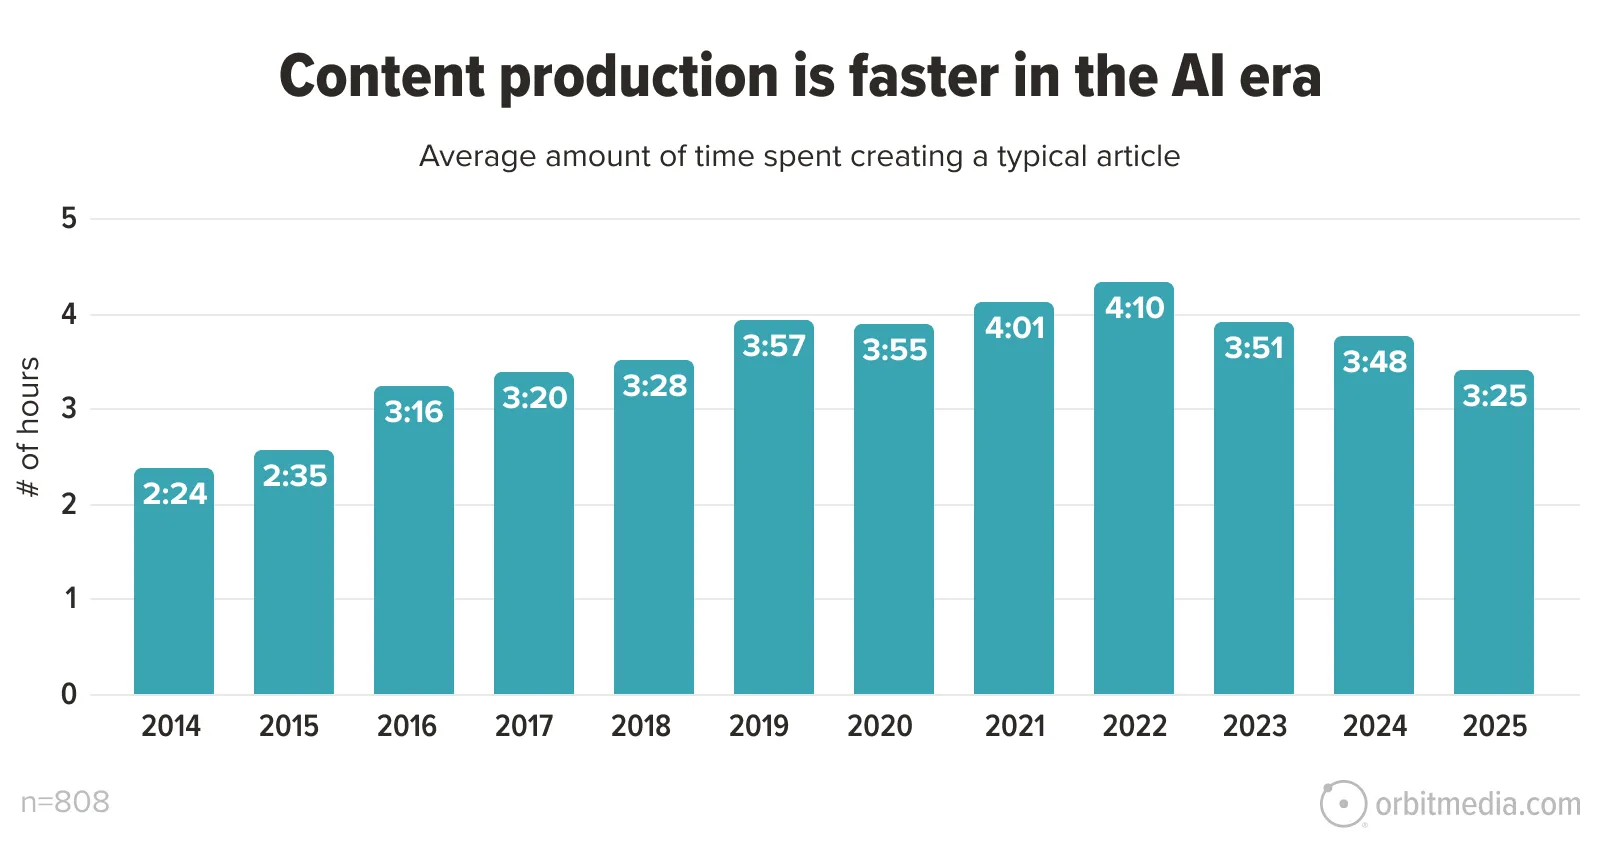
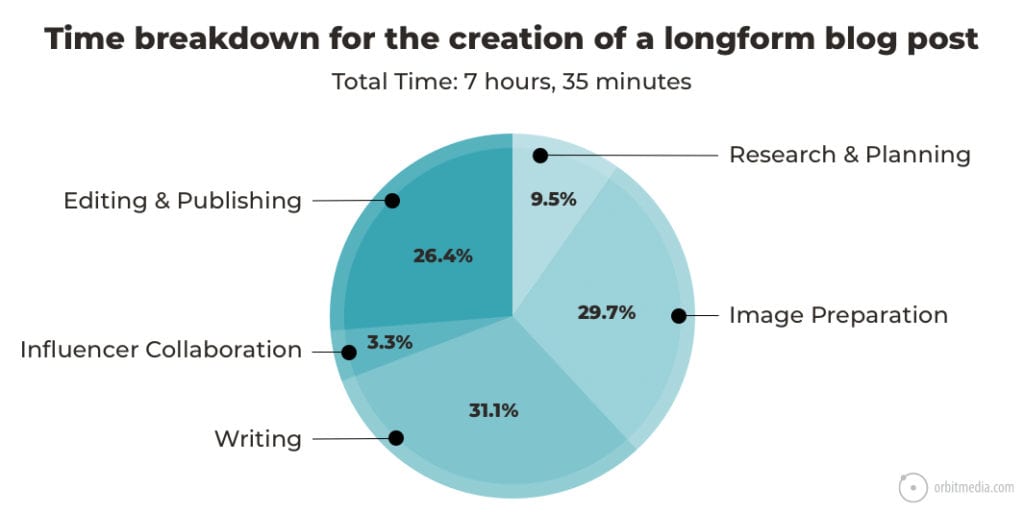
Further insights into the practicalities of content creation are provided by data from Orbit Media’s annual blogger survey. A chart detailing the time investment required to produce a single blog post reveals trends over several years, peaking in 2022 and showing a slight decrease by 2025. This data offers valuable benchmarks for content teams regarding resource allocation.
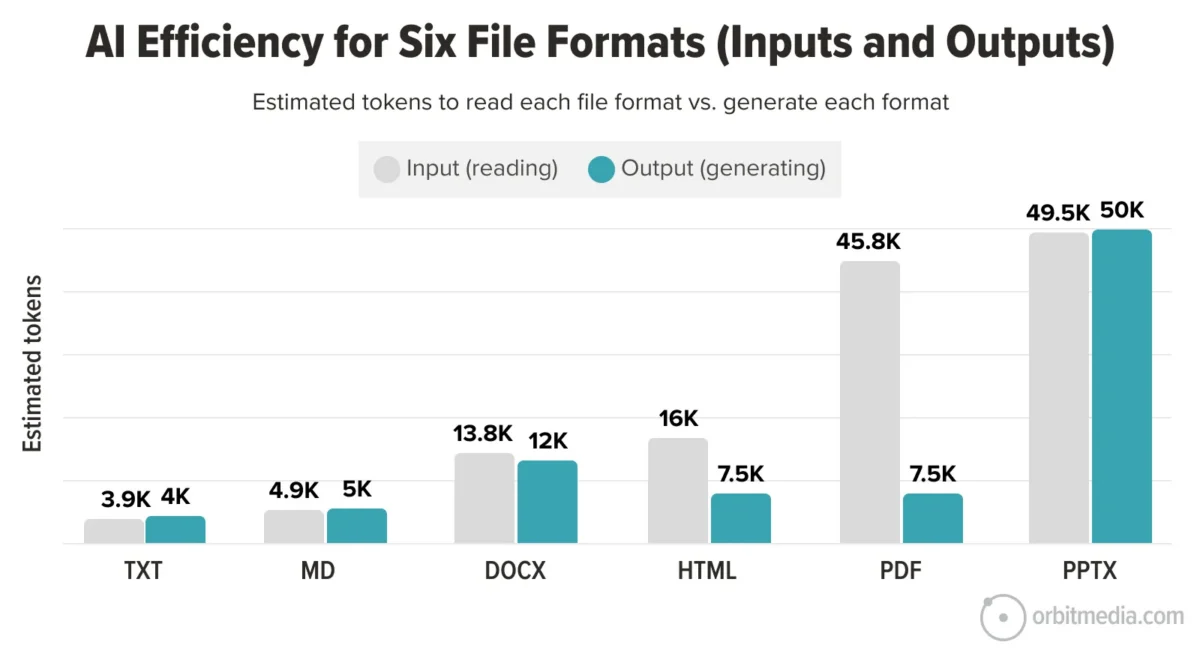
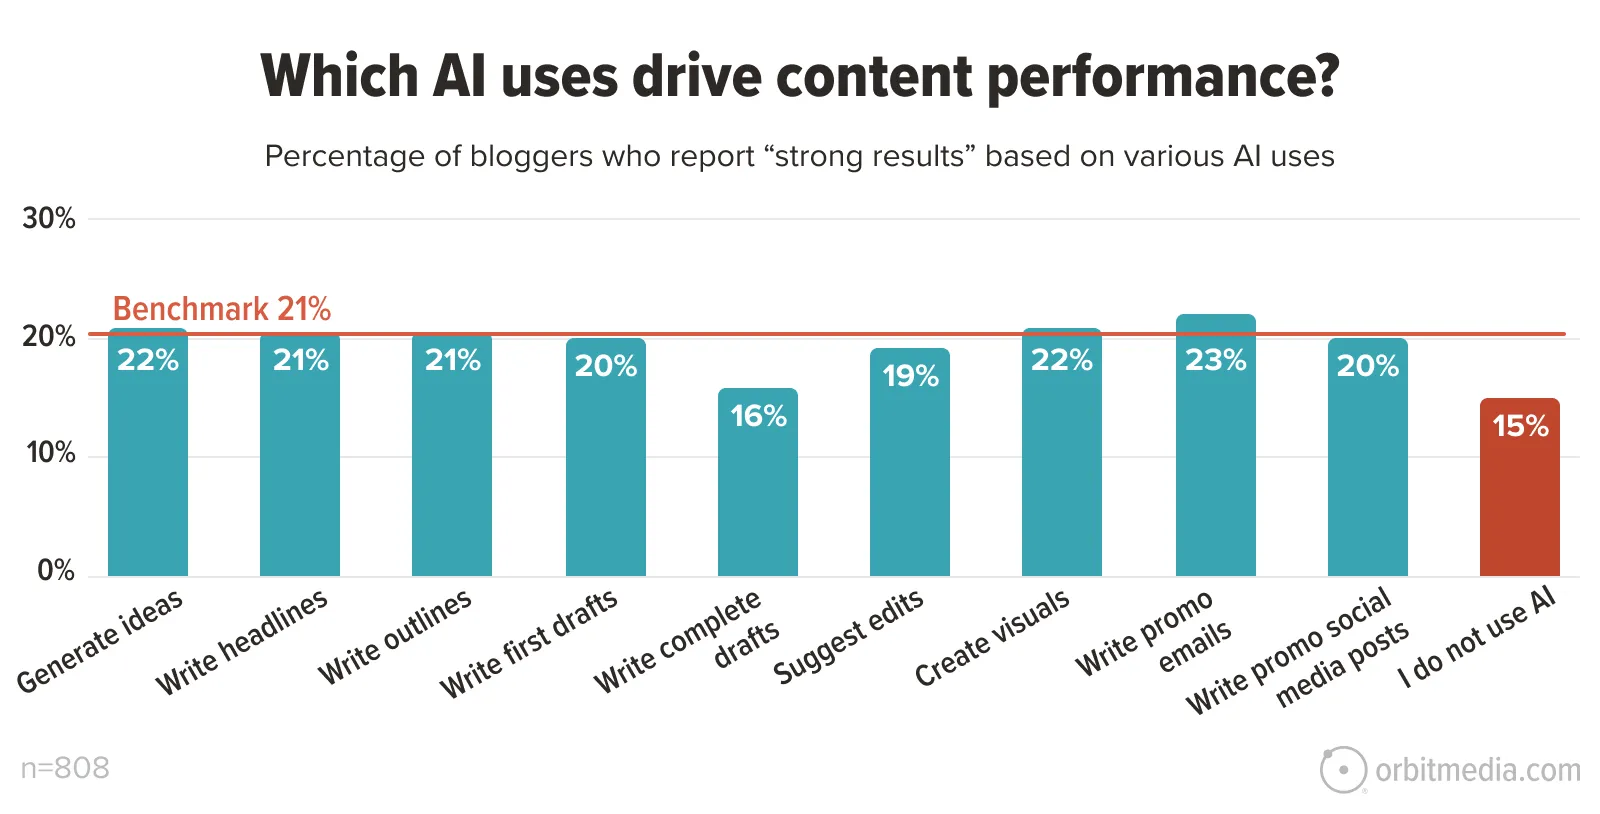
The increasing integration of Artificial Intelligence (AI) into content marketing is also explored. A compelling bar chart addresses the question: "Which AI use cases are driving content marketing results?" The data suggests a balanced approach, indicating that while AI can be a powerful tool, its effective use lies somewhere between complete avoidance and over-reliance. Another diagram, "AI efficiency: input and output formats," delves into the technical aspects of AI, illustrating the varying token and carbon impacts associated with different file formats when processed by AI models. This is a critical consideration as the industry grapples with the environmental footprint of AI technologies.
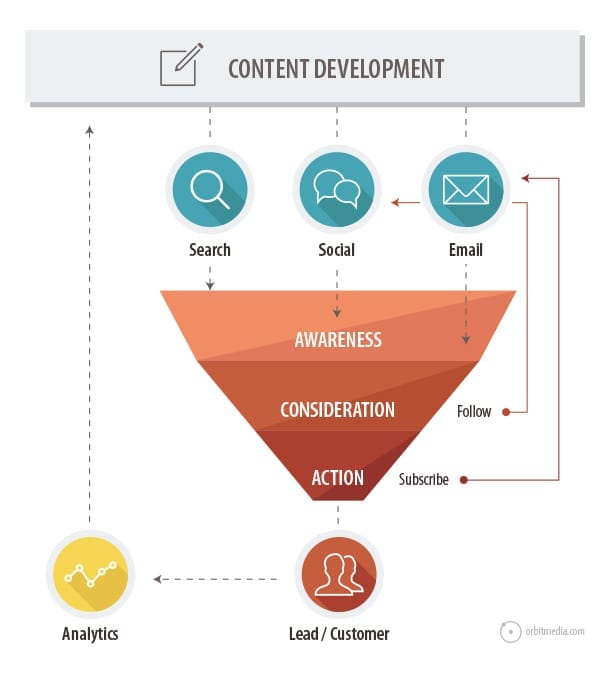
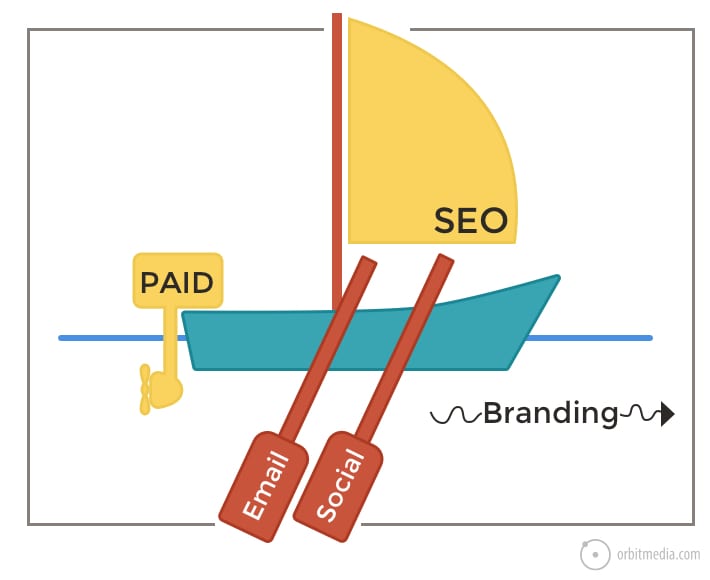
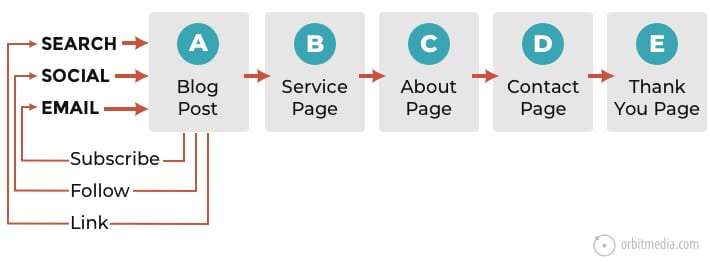
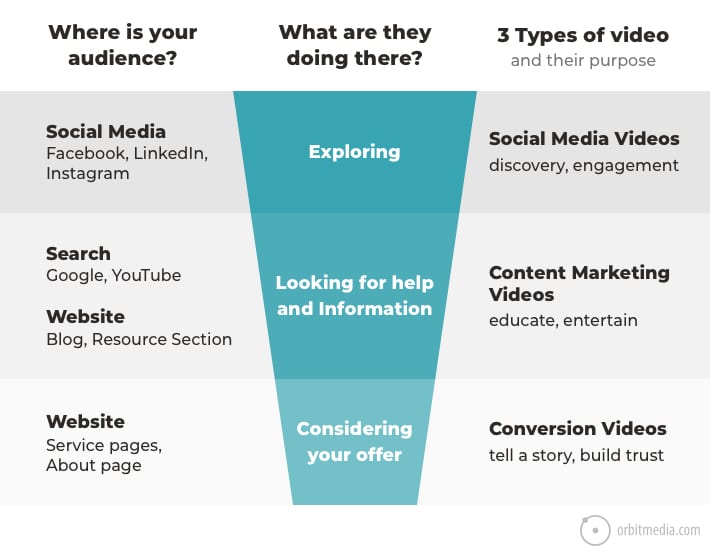
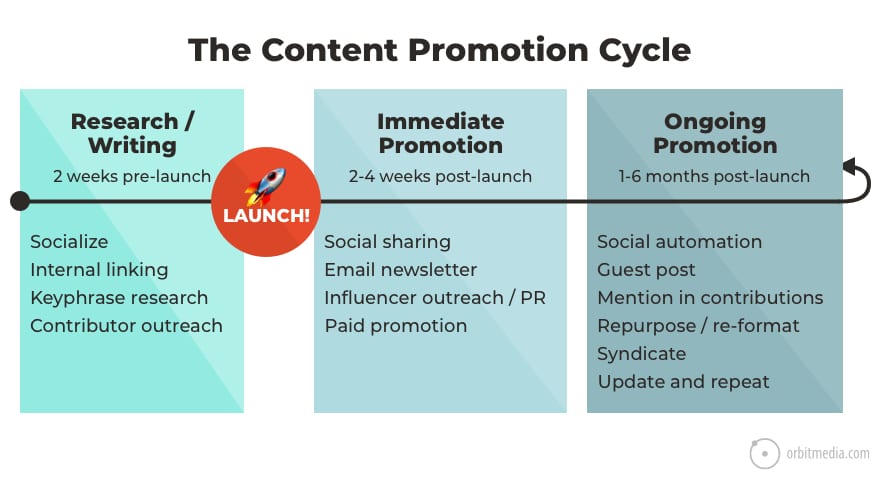
The lifecycle of content is further dissected with diagrams on content promotion channels and their alignment with the marketing funnel. These visuals demonstrate how search, social media, and email marketing contribute to different stages of customer awareness and consideration. The "Virtuous Cycle of Blog Traffic" illustrates how initial engagement can foster ongoing interest and eventual lead generation, highlighting the interconnectedness of various marketing activities.
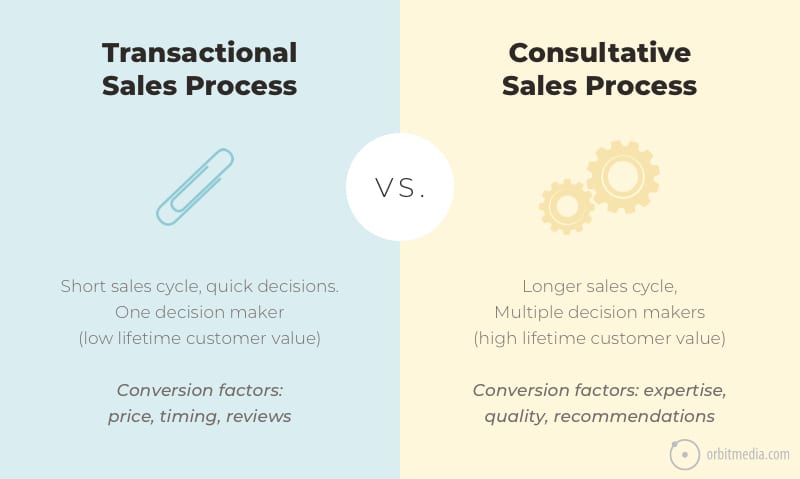
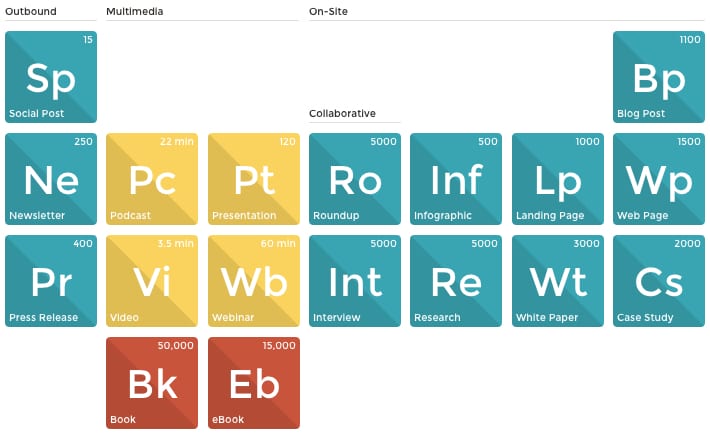
A particularly useful visual for content strategists is "The Content Performance Matrix." This 2×2 matrix categorizes content based on traffic and engagement, suggesting distinct strategies for "Polish," "Pursue," "Pass," and "Promote." This framework provides a clear roadmap for managing and optimizing existing content assets. The distinction between "Transactional and Consultative" offerings is also visualized, underscoring the need for tailored marketing approaches based on the nature of the product or service. Finally, the foundational concepts of "Brand Marketing vs. Performance Marketing" are laid out, differentiating their goals, timelines, and metrics. The "Periodic Table of Content" offers a comprehensive overview of content formats, serving as a powerful brainstorming tool for content repurposing.
Navigating SEO and AI Search Optimization with Clarity
The rapidly evolving landscape of search engine optimization (SEO) and the emergence of AI-powered search are critical areas where visual aids prove invaluable. A foundational comparison is presented in "Traditional search vs. AI search," which delineates the fundamental shift from ranking and clicking to recommendation and context-aware responses. This visual dissects the technological, user experience, and marketing implications of this paradigm shift.
The nomenclature surrounding AI-driven search optimization is a subject of ongoing discussion, as highlighted by the pie chart "What is AI Search Optimization called?" This visualization reveals a lack of consensus within the SEO community, showcasing various acronyms and terms used to describe this emerging field. The diagram "Organic lead generation in the era of AI" illustrates how the user journey is being reshaped, moving from active search queries to direct AI-generated recommendations.
Further clarifying the nuances of search, "Are people switching from search to AI chat tools?" presents projections for the adoption of AI chat versus traditional search engines for research, indicating a growing preference for AI. The diagram "When do people prefer to ask an AI chatbot?" provides further granularity, showing that while AI is gaining traction across various query types, local search remains an area where traditional search methods still hold sway, partly due to AI’s current limitations in integrating with mapping services.
Key SEO concepts are distilled into easily digestible visuals. "The three types of keyphrases" categorizes search terms based on user intent—KNOW, DO, and GO—providing a framework for targeting specific stages of the buyer journey. "The two main search ranking factors" simplifies SEO into its core components: authority and relevance, emphasizing their paramount importance. For those focused on off-page SEO, the "Link reclamation flowchart" offers a practical guide to transforming brand mentions into valuable backlinks. The criteria for selecting effective keywords are visually represented in a Venn diagram, illustrating the balance between search volume, competition, and relevance.

The relationship between domain authority and keyword length is explored in a chart that suggests a strategic advantage for targeting longer, less competitive phrases, especially for entities with lower domain authority. The complex notion of "What’s that link worth?" is demystified through a breakdown of seven factors that determine link equity. Finally, the impact of user interaction signals on search rankings is visualized through the concept of "short vs. long clicks," highlighting the importance of user engagement and dwell time.
Social Media and Influencer Marketing: Strategies Visualized
The world of social media and influencer marketing, often driven by engagement and audience perception, benefits greatly from clear visual representations of strategy and impact. A study on social media spam reveals which platforms are most affected, with Twitter/X notably showing a higher percentage of reported spam in recent years. This data is crucial for marketers assessing platform trustworthiness and potential audience reach.
The "Social media ‘Rule of Thirds’" provides a balanced framework for content distribution, advocating for a mix of sharing, engaging, and promoting. This simple yet effective model helps marketers maintain a dynamic and engaging social media presence. The diverse landscape of influencers is mapped out in "The five types of influencers," categorizing them from nano-influencers to mega-celebrities, acknowledging that influence exists at various scales.
The strategic alignment of influencer marketing is clarified by "Influencer marketing strategy: Formats and outcomes." This diagram demonstrates how different channels and content formats yield varied results, from traffic generation to lead acquisition. The symbiotic relationship between influencers and SEO is explored in "How influencers affect search engine rankings," illustrating how influencer collaborations, particularly those generating backlinks, can significantly boost a website’s domain authority and search visibility. Essential for personal branding, "Profile picture best practices" offers a visual guide to creating professional and impactful profile images, a small but significant detail in online presence.
Enhancing Web Design and User Experience with Visuals
Effective web design and user experience (UX) are pivotal for conversion, and visual aids offer profound insights into these areas. The "Psychology of conversion" diagram visualizes the fundamental principle that motivation must outweigh friction, a core tenet of UX design. The importance of building trust is underscored in "Adding evidence to webpages," which contrasts unsupported claims with the strategic use of testimonials, data, and awards.
Best practices for critical website pages are thoroughly detailed. "Contact page best practices" uses a before-and-after comparison to illustrate how clarity, trust, and usability can transform a contact form from a point of friction into a conversion driver. Similarly, "About us page best practices" breaks down the essential elements of a compelling narrative that answers visitor questions and fosters connection. The immediate impact of design on user perception is addressed in "Homepage design: Quick communication with descriptive labels," emphasizing the need for instant clarity on page relevance.
"Service page design: The 13-point checklist" provides a comprehensive guide to optimizing pages for sales conversations, covering aspects from visual support to SEO optimization. The anatomy of a powerful testimonial is deconstructed in "The anatomy of a great testimonial," highlighting the effectiveness of including logos, headlines, pictures, and keywords. The visual impact of color is explained through "Color and visual prominence," demonstrating how complementary colors create contrast to draw attention. The broader principles of guiding user attention are covered in "The laws of visual hierarchy," detailing how position, size, whitespace, and movement influence perception. Finally, "Web design standards" offers insights into the most common and expected features on contemporary websites. The power of human connection in driving action is visually demonstrated in "Making calls to action personal," showing how incorporating faces near CTAs can improve click-through rates.
Data-Driven Marketing and Google Analytics: Visualizing Insights
The final category of visuals focuses on the crucial domain of data-driven marketing and analytics. The distinction between mere reporting and actionable analysis is emphasized in "How to make marketing decisions using data," positioning analytics as a vital decision support tool. The process of "Hypothesis formation" is visualized as a flowchart, guiding marketers to move from ideas to testable propositions backed by data.
Beyond analytics, "Sources (and quality) of marketing insights" maps out various avenues for gathering intelligence, illustrating that data can come from a multitude of places, each with varying degrees of quality. The comprehensive "12 types of marketing research methods" broadens the perspective beyond digital tools, showcasing a diverse array of research techniques available to marketers.
The Enduring Power of Visuals in Marketing
The overarching theme reinforced throughout this collection is the profound impact of visuals in demystifying complex marketing concepts. As the article aptly concludes, while many marketers are skilled writers, the inherent advantages of visuals—their ability to convey information quickly, enhance memory retention, and increase engagement—are undeniable. Orbit Media’s commitment to embedding original diagrams in their content and their book, "The Illustrated Handbook for Content Marketing," underscores this philosophy. The final diagram, "How to use visuals in your marketing," serves as a capstone, illustrating the strategic application of visuals across various marketing channels to drive tangible metrics. The creation of these powerful visual assets is largely attributed to Jantzen Loza, a key member of the Orbit Media team, whose contributions are essential to the company’s content strategy. The permission to use these diagrams, coupled with the offer of support, makes this resource an invaluable asset for any marketer seeking to enhance their understanding and execution of digital marketing strategies.