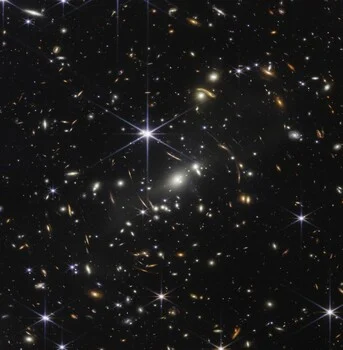

The breathtaking "Cosmic Cliffs" of the Carina Nebula, which captivated the global public when unveiled by NASA in July 2022 as part of the James Webb Space Telescope’s inaugural image collection, present a visual contradiction. The vibrant teal peaks and dramatic orange hazes adorning the portrait do not exist in the human visual spectrum. Nearly all of the light captured by the observatory is fundamentally invisible to the naked human eye, originating from infrared wavelengths that require specialized technological intervention to visualize. Far from diminishing the value of these astronomical portraits, understanding the complex translation process from invisible radiation to vivid imagery reveals a profound technological achievement that deepens our comprehension of the universe.
Main Facts and the Mechanics of Infrared Observation
Operating far beyond the red edge of human vision, the James Webb Space Telescope (JWST) was engineered specifically to detect infrared radiation. While human eyes and conventional digital camera sensors are limited to a narrow slice of the electromagnetic spectrum peaking at roughly 0.7 microns, Webb’s primary imaging apparatus functions on a vastly broader scale. The Near-Infrared Camera (NIRCam) operates across wavelengths from approximately 0.6 to 5 microns, while the Mid-Infrared Instrument (MIRI) extends its reach up to roughly 28 microns.
This technological focus is rooted in fundamental astrophysics. As the universe expands, light emitted by the most ancient, distant galaxies is stretched across space, shifting ultraviolet and visible wavelengths into the infrared spectrum by the time they reach Earth. Furthermore, infrared light possesses the physical property of passing unimpeded through the dense interstellar dust clouds that entirely block visible light. This capability enables Webb to pierce through cosmic obscuration to observe active stellar nurseries—regions where stars are actively born—that remained impenetrable to its predecessor, the Hubble Space Telescope.
Despite the rich palettes seen in published media, Webb’s scientific instruments natively record data in strict monochrome. The light-sensitive detector chips within NIRCam capture pure brightness measurements, yielding one numerical value per pixel without any embedded color information. A single raw exposure is essentially a grayscale frame capable of recording more than 65,000 distinct shades of gray. Color is entirely absent from the raw data stream.
The Chronology and Development of Astronomical Visualization
The methodology of transforming monochrome, multi-filter astronomical data into vivid color composites is not a recent invention unique to the JWST mission; rather, it is a refined technique built upon decades of established astrophotography standards used by both professional observatories and advanced amateurs.
When astronomers set out to image a target like the Carina Nebula or the Pillars of Creation, they do not simply point a camera and capture a snapshot. Instead, they expose the target sequentially through a series of specialized glass filters. NIRCam alone carries 29 distinct filters, while MIRI houses 9. Each filter is engineered to permit only a narrow, precise slice of the infrared spectrum to pass while blocking all other wavelengths. For instance, filter F090W captures light near 0.9 microns, whereas F470N is a specialized narrowband filter tuned precisely to isolate the thermal glow of molecular hydrogen.
The chronological workflow from raw photon collection to final published image follows a rigorous sequence:
- Data Acquisition: The telescope captures multiple sequential grayscale exposures, with each individual frame isolating a specific wavelength band through a designated filter.
- Artifact Reduction: Processing teams clean the raw frames, removing detector anomalies, cosmic-ray impacts, and background noise.
- Chromatic Ordering: Processors map the filtered grayscale data to visible color channels. By convention, astronomers utilize chromatic ordering—assigning the shortest infrared wavelengths to the shortest visible wavelengths (blue) and the longest infrared wavelengths to the longest visible wavelengths (red).
- Dynamic Range Compression and Balancing: Technicians apply mathematical functions to lift faint details in darker regions while preserving highlights, followed by color-balance adjustments to ensure scientific clarity and visual fidelity.
Supporting Data and Filter Architecture
To understand how data becomes art, one must examine the specific mechanics of image composition. While chromatic ordering serves as a foundational baseline, processing scientists retain the analytical flexibility to adjust assignments when demanded by scientific utility.
In the published image of the Cosmic Cliffs within NGC 3324—located approximately 7,600 light-years away—the science team utilized six distinct filters mapped to a deliberate color key:
- F090W: Assigned to blue (representing the shortest captured wavelengths)
- F187N: Assigned to cyan
- F200W: Assigned to green
- F470N: Assigned to yellow
- F335M: Assigned to orange
- F444W: Assigned to red (representing the longest captured wavelengths in this specific set)
This configuration intentionally places the longest filter at yellow rather than deep red, a deliberate decision designed to highlight specific structural features. Alyssa Pagan, a science visuals developer at the Space Telescope Science Institute (STScI), explains that while chromatic ordering provides the greatest scientific value and natural aesthetic, processors will occasionally stray from strict wavelength order to ensure critical scientific phenomena remain distinct to the human eye.
A prime example involves narrowband filters. When a filter like F470N—tuned to molecular hydrogen—sits adjacent to a broadband filter like F444W, assigning them contrasting visible colors prevents the hydrogen emissions from bleeding into the background noise, thereby allowing stellar jets and protostellar outflows to "pop" out of the composite image. Joe DePasquale, an STScI visuals expert who worked on the iconic NIRCam view of the Pillars of Creation, notes that flexibility in color mapping is essential for extracting maximum detail from complex multi-wavelength datasets without compromising the underlying physical data.
Official Responses and Addressing Public Skepticism
The public release of high-definition space imagery routinely prompts inquiries regarding authenticity, with critics occasionally dismissing the vivid hues as "fake" or overly artistic fabrications. Space agency representatives and visualization scientists have consistently addressed these misconceptions through transparent educational outreach.
"There is an audience of people that think this is fake, just because it’s representational," Alyssa Pagan notes. "But when you’re talking about ultraviolet or infrared, how else are you supposed to represent it?"
Scientists emphasize that separating what is measured fact from what is chosen aesthetic translation is critical to scientific literacy. The structural architecture of every Webb image—every filament, carved cavity, ridge, and pinpoint star—represents hard physical measurement recorded precisely where the telescope observed it. The relative spatial relationships and morphological structures are absolute data, not decoration. Conversely, the specific hue assigned to a given micron-level wavelength is a deliberate visualization choice, necessitated by the biological limitations of the human visual system, which cannot natively perceive infrared radiation.
This translation methodology mirrors standard practices across numerous scientific disciplines. Medical imaging techniques routinely assign false color to magnetic resonance imaging (MRI) scans to differentiate tissue densities, and meteorological charts color-code atmospheric temperatures. These representations are universally accepted as accurate data translations rather than fabrications.
Broader Impact and Implications for Astronomical Research
The deployment and ongoing operation of the James Webb Space Telescope mark a transformative era in observational astronomy, fundamentally altering our understanding of stellar evolution, galaxy formation, and cosmic history. By mastering the translation of infrared data into comprehensible visual formats, researchers are able to communicate complex astrophysical phenomena to the global public while simultaneously advancing rigorous scientific analysis.
The implications extend far beyond aesthetics. The ability to peer through dense dust obscurations allows astronomers to document the earliest stages of star and planet formation with unprecedented precision. As Webb continues to scan the deep cosmos, its data archives serve as an invaluable repository for researchers worldwide, validating theoretical models of the early universe and identifying signatures of planetary systems forming around distant stars.
Ultimately, the vibrant imagery produced by the mission serves a dual purpose: it functions as a rigorous empirical dataset for astrophysicists and an accessible gateway for humanity to witness the architecture of the cosmos. As science visualization teams continue to refine their translation techniques, they ensure that the hidden universe remains legible to the human eye—proving that assigned colors do not obscure reality, but rather illuminate a truth that would otherwise remain forever in the dark.